General Description
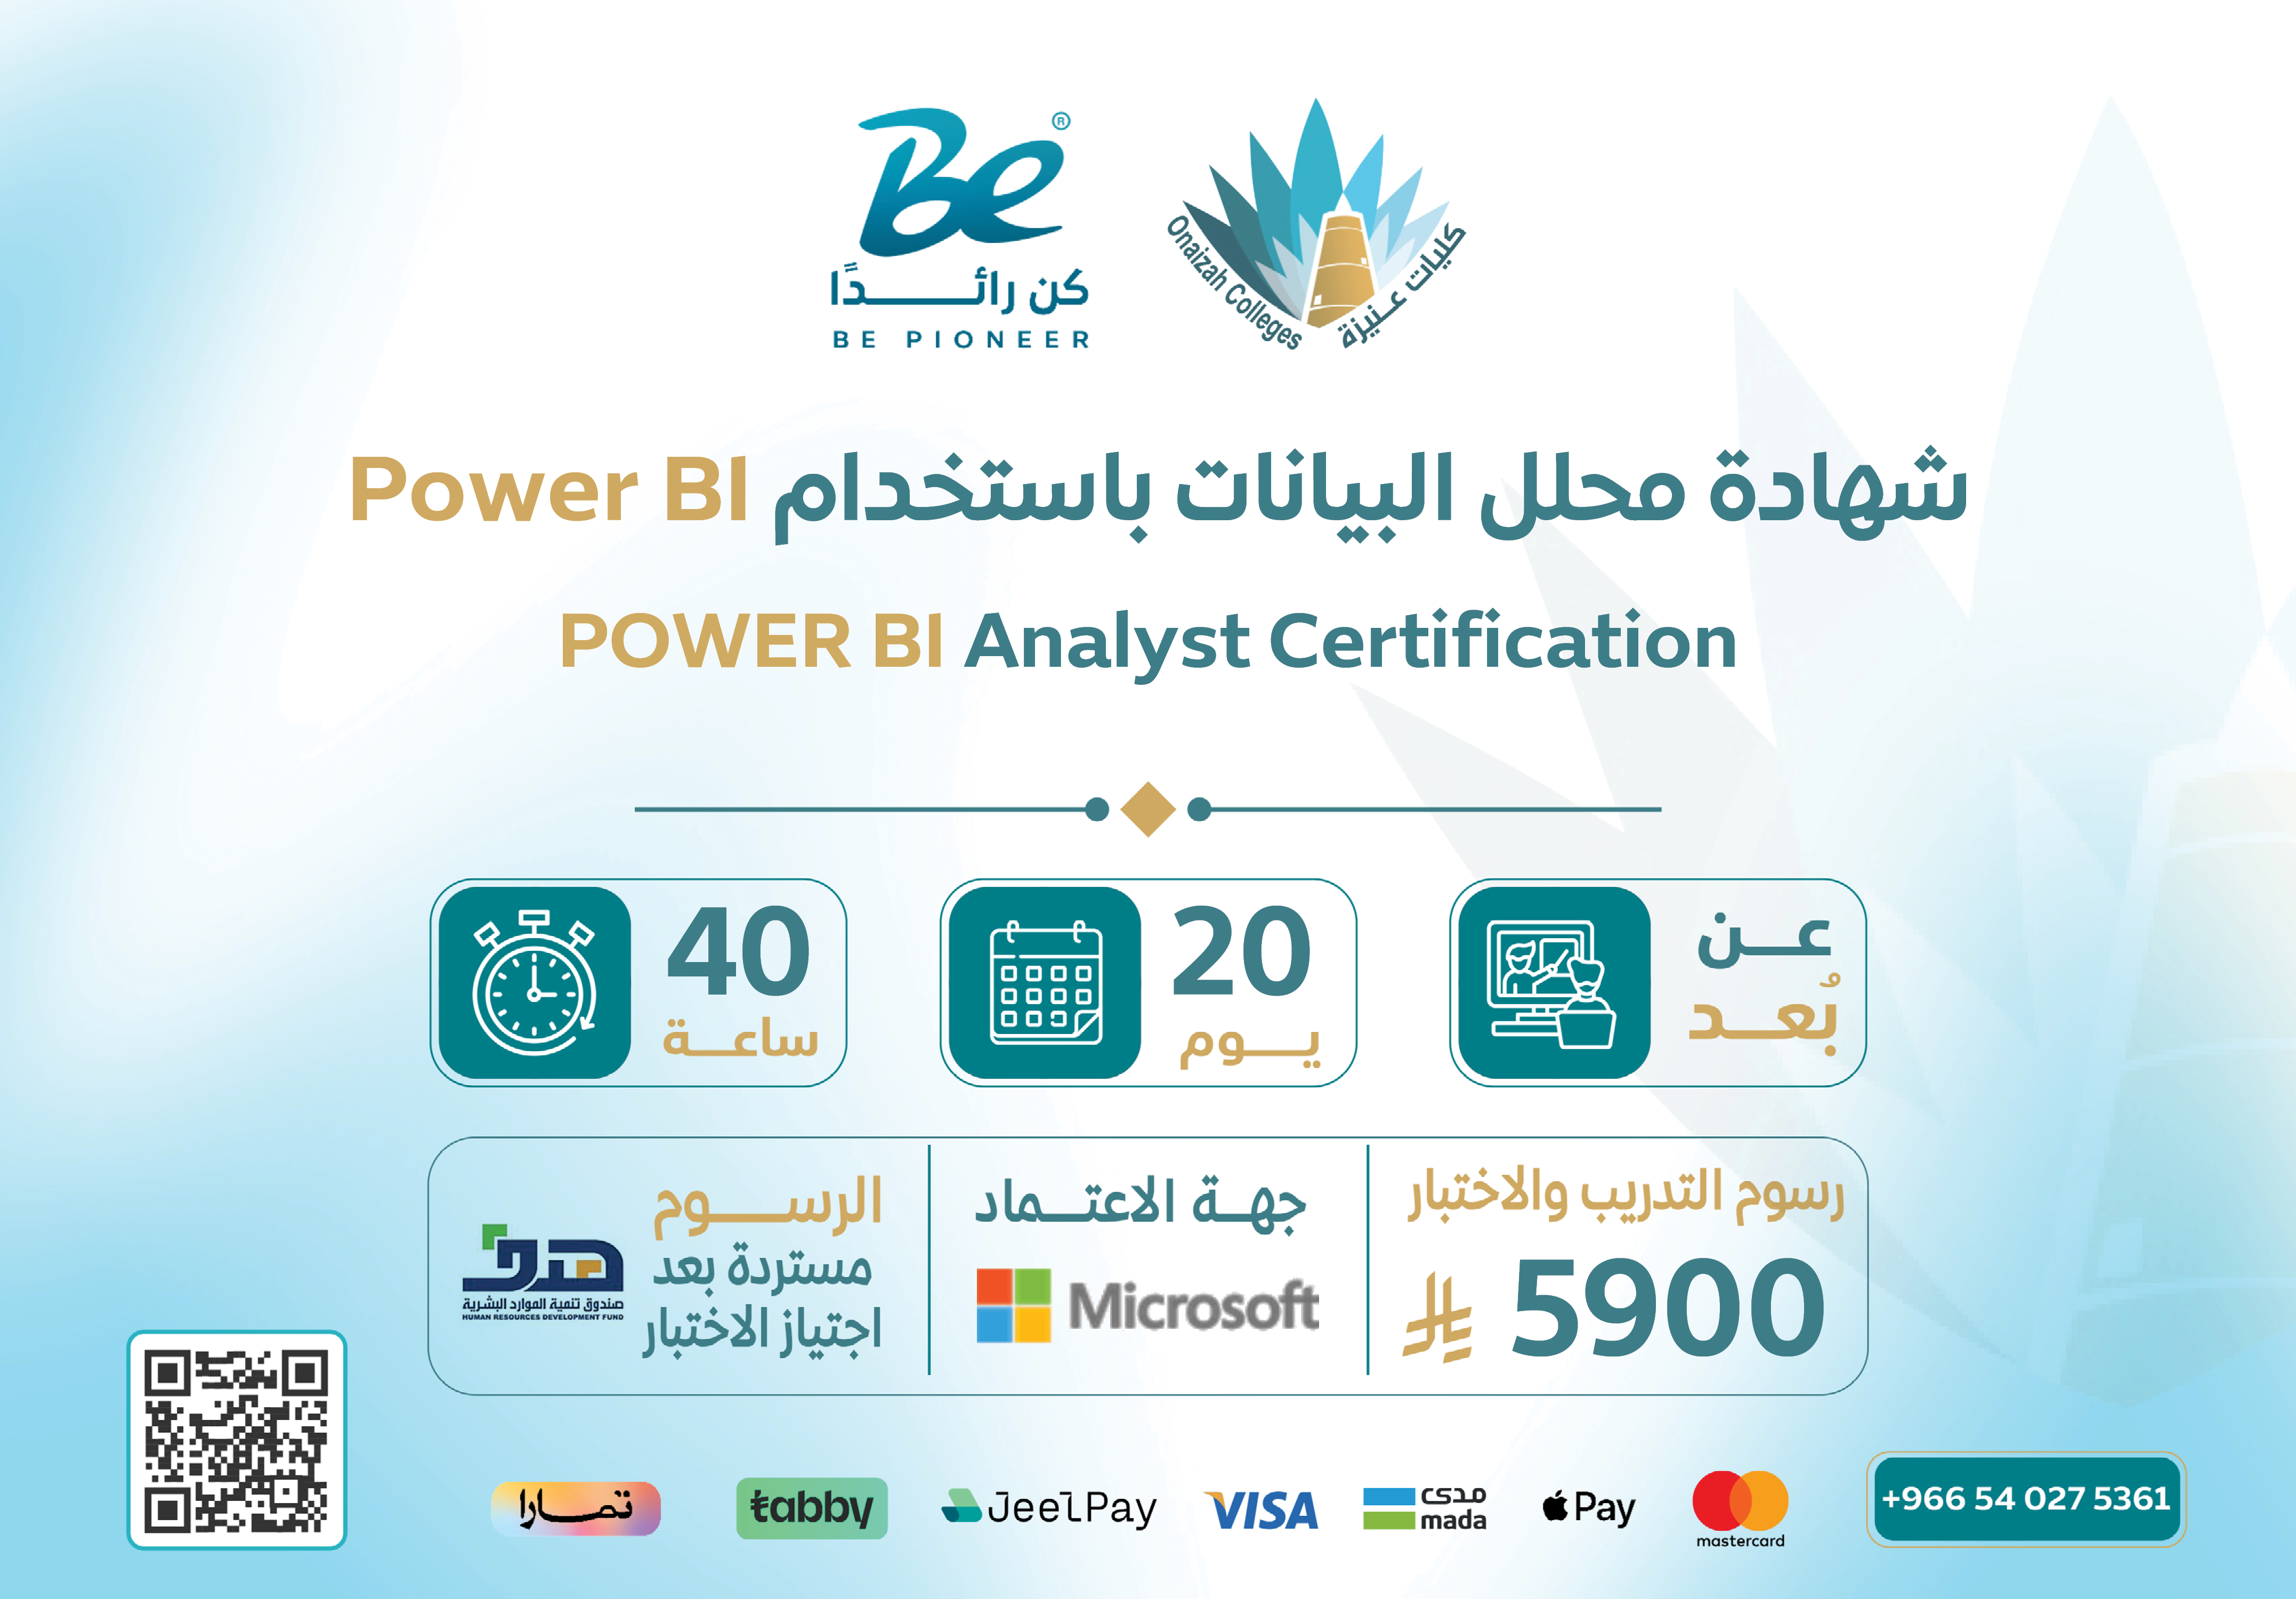
The Microsoft Certified: Power BI Data Analyst Associate course is a specialized training program designed to equip participants with the practical knowledge and skills required to prepare, model, analyze, and visualize data using Microsoft Power BI. It helps learners turn raw data into meaningful insights that support decision-making and improve performance in modern work environments. Microsoft states that this certification demonstrates methods and best practices aligned with business and technical requirements for modeling, visualizing, and analyzing data with Power BI.
The Goals
-
Provide participants with the practical knowledge and skills needed to prepare, model, and analyze data using Power BI .
-
Enable participants to design interactive reports and dashboards that transform data into clear insights supporting decision-making .
-
Develop the ability to use Power Query and DAX to efficiently clean, model, and analyze data .
-
Prepare participants to successfully pass the Microsoft PL-300 (Power BI Data Analyst) certification exam.
-
Enhance participants' ability to collaborate with stakeholders to identify business requirements and deliver valuable analytical solutions .
Target Auidence
-
Data analysts and business intelligence professionals seeking to master Power BI .
-
Graduates in finance, accounting, business administration, and IT who want to build a career in data analytics .
-
Professionals in marketing, operations, and HR who work with data in their daily roles.
-
Advanced Excel users looking to transition to more powerful data analysis tools .
-
Anyone seeking a globally recognized certification in data analysis using Power BI, even without an engineering background .
The Features
-
Globally recognized certification from Microsoft, one of the most in-demand certifications in data analytics worldwide .
-
Updated syllabus reflecting the latest Power BI practices, with major updates effective January 2026 .
-
Comprehensive coverage of the complete data analysis lifecycle: prepare → model → visualize → manage & secure .
-
Exam flexibility available in 11 languages (including Arabic) with option to request 30 additional minutes for non-native speakers .
-
High professional value opening doors to roles such as Data Analyst, Business Intelligence Analyst, and BI Developer at major companies .
-
Affordable cost at approximately $165 USD, with retake options available .
Topics
1. Prepare the Data (25-30%)
-
Connect to data sources: databases, Excel files, cloud
-
Clean and transform data using Power Query
-
Handle missing values, duplicates, and inconsistent data
-
Choose appropriate connection mode (DirectQuery or Import)
2. Model the Data (25-30%)
-
Design scalable data models
-
Create table relationships with cardinality and cross-filter direction
-
Write DAX calculations (including CALCULATE and Time Intelligence)
-
Optimize model performance and reduce data complexity
3. Visualize and Analyze the Data (25-30%)
-
Create interactive reports and dashboards
-
Select appropriate visuals for each data type
-
Use Copilot to create report pages and visual content
-
Identify patterns and trends using advanced analytics features (clustering, forecasting, AI visuals)
4. Manage and Secure Power BI (15-20%)
-
Create and manage workspaces
-
Publish and share reports and apps
-
Implement Row-Level Security (RLS)
-
Schedule data refresh and configure alerts
Learning outcomes
-
Successfully pass the Microsoft PL-300 certification exam (40-60 questions over 100 minutes, passing score 700 out of 1000) .
-
Ability to connect to multiple data sources, clean, and transform them into analysis-ready format.
-
Ability to design complex data models using DAX to create custom measures and calculations .
-
Ability to create interactive reports and dashboards that clearly communicate insights to decision-makers.
-
Ability to share, secure, and manage report access in the Power BI service .
-
Qualification for roles: Data Analyst, Business Intelligence Analyst, and Power BI Developer.
Requirements And Conditions
-
Basic computer literacy and familiarity with operating systems.
-
Fundamental knowledge of Microsoft Excel and working with spreadsheets and data.
-
Ability to understand and interpret data at a basic level.
-
Basic mathematical and statistical skills to help analyze and interpret data.
-
Willingness to learn data analysis and data visualization tools using Power BI.
-
No advanced professional experience in data analysis is required; previous experience is considered an advantage.
-
Access to a computer capable of installing and running Microsoft Power BI Desktop.
-
Interest in developing analytical skills and making data-driven decisions.
FAQs
The Blog
Power BI Data Analyst Certification | Your Guide to Building a Career in Data Analytics
Data has become one of the most valuable resources for modern organizations. Businesses collect enormous amounts of information from sales, customers, marketing campaigns, operations, finance, human resources, and other departments. However, collecting data is only the first step. The real value comes from the ability to organize, analyze, and transform that data into meaningful insights that support better business decisions.
This is where the role of a Power BI Data Analyst becomes increasingly important. Data analysts use specialized tools to prepare data, identify patterns, create reports, and present insights in a clear and understandable way. Among the most widely used business intelligence tools is Microsoft Power BI.
Microsoft offers a professional certification called Microsoft Certified: Power BI Data Analyst Associate, which focuses on using Power BI to prepare, model, visualize, and analyze data, as well as manage and secure Power BI content. The certification is associated with the PL-300 exam.
Through Be Pioneer, learners can explore professional development opportunities in data analytics and understand how Power BI skills can contribute to a modern career path.
What Is the Power BI Data Analyst Certification?
The Microsoft Certified: Power BI Data Analyst Associate certification is a Microsoft professional certification designed around the skills required to work with Power BI as a data analyst.
According to Microsoft, the certification focuses on four major areas: preparing data, modeling data, visualizing and analyzing data, and managing and securing Power BI.
The certification is not simply about creating attractive charts. A Power BI data analyst needs to understand the complete data workflow, beginning with connecting to data sources and preparing raw information, then creating an effective data model, developing calculations, building interactive reports, analyzing results, and managing access to published content.
This makes the certification particularly relevant to professionals who want to demonstrate structured knowledge of Power BI and its role in business intelligence.
What Is Microsoft Power BI?
Microsoft Power BI is a business intelligence and data visualization platform that helps users connect to data sources, transform information, create data models, perform analysis, and develop interactive reports and dashboards.
Power BI can work with different types of data sources, allowing organizations to bring information from multiple systems into analytical reports.
For example, a company could use Power BI to analyze sales performance by product, region, month, or sales representative. Instead of reviewing thousands of individual records, decision-makers can use interactive dashboards to identify trends, compare performance, and monitor key metrics.
The ability to turn complex datasets into understandable visual reports is one of the reasons Power BI has become an important tool for data-driven organizations.
Why Is Power BI Important for Data Analysis?
Organizations today need more than large amounts of data. They need people who can understand what the data means and communicate its findings effectively.
A business may have information about thousands of customers and transactions, but decision-makers still need answers to questions such as:
-
Which products generate the most revenue?
-
Which regions are performing best?
-
How have sales changed over time?
-
Which customer segments are growing?
-
Where are performance problems occurring?
-
Which trends could affect future business decisions?
A Power BI Data Analyst helps answer these questions by transforming raw information into useful reports and analytical insights.
Microsoft describes the Power BI Data Analyst role as involving data preparation, modeling, visualization, analysis, and the management and security of Power BI content. Microsoft also identifies Power Query and DAX as important skills for this role.
How Does a Power BI Data Analyst Work?
The work of a data analyst can be viewed as a series of connected stages.
The process usually begins by understanding the business question that needs to be answered. The analyst then identifies the appropriate data sources and connects Power BI to them.
The next stage involves preparing and transforming the data. This may include removing duplicates, correcting data types, handling missing values, and restructuring tables.
After that, the analyst builds a data model and establishes relationships between tables. DAX can then be used to create measures and calculations required for analysis.
Once the data model is ready, the analyst creates reports and dashboards using appropriate visualizations.
Finally, reports can be published and managed, with appropriate permissions and security settings applied.
This process demonstrates that Power BI data analysis goes far beyond creating charts. It involves a complete workflow for turning raw information into actionable business insights.
Data Preparation in Power BI
Data preparation is one of the most important stages of the Power BI workflow.
Raw data is rarely ready for immediate analysis. It may contain duplicate records, missing values, inconsistent formats, incorrect data types, or unnecessary information.
Power BI provides Power Query, which allows analysts to transform data before using it in their models and reports.
Common data preparation tasks include:
-
Changing data types.
-
Removing duplicate records.
-
Handling missing or incorrect values.
-
Splitting and merging columns.
-
Combining data from different sources.
-
Filtering unnecessary information.
-
Restructuring tables.
-
Creating calculated or conditional columns.
According to Microsoft's current PL-300 study guide, data preparation represents approximately 25% to 30% of the exam content.
This highlights the importance of developing strong data preparation skills. Accurate analysis starts with reliable and well-structured data.
Data Modeling in Power BI
Once data has been prepared, the next step is data modeling.
A good data model helps Power BI understand how different tables relate to one another. This is essential when working with datasets containing information about customers, products, transactions, dates, locations, and other business entities.
For example, a sales model may include a sales table connected to customer, product, and date tables. Establishing these relationships correctly allows analysts to create accurate calculations and interactive reports.
Data modeling can involve:
-
Creating relationships between tables.
-
Managing relationship types.
-
Creating date tables.
-
Establishing appropriate filtering behavior.
-
Creating calculated columns.
-
Creating measures.
-
Optimizing the structure of the model.
Data modeling also accounts for approximately 25% to 30% of the current PL-300 exam according to Microsoft.
What Is DAX in Power BI?
DAX, or Data Analysis Expressions, is one of the most important technical skills for Power BI Data Analysts.
DAX is used to create calculations and measures that allow analysts to perform more advanced analysis.
For example, an analyst can create measures to calculate:
-
Total sales.
-
Average sales value.
-
Profit margins.
-
Year-over-year growth.
-
Percentage changes.
-
Running totals.
-
Performance comparisons.
Learning DAX is not simply about memorizing formulas. Analysts also need to understand how calculations interact with the data model and filter context.
Microsoft identifies DAX as an important skill for the Power BI Data Analyst role and includes DAX-related tasks within the PL-300 exam.
Creating Power BI Reports and Dashboards
After preparing and modeling the data, analysts can create interactive reports.
Power BI provides a wide range of visualization options, including bar charts, line charts, tables, cards, maps, and other visual elements.
However, effective reporting is not simply about choosing attractive visuals. The visualization should make the underlying information easier to understand.
For example, a line chart may be suitable for showing sales trends over time, while a bar chart may be more useful for comparing products or regions.
The current PL-300 skills outline includes creating and formatting reports, configuring visualizations, using filters, improving report usability, and creating navigation features.
Data Visualization and Data Storytelling
One of the most valuable skills for a data analyst is the ability to communicate findings clearly.
Data visualization transforms numerical information into visual representations that make patterns, comparisons, and trends easier to identify.
This connects closely with data storytelling, where the analyst uses visualizations and reports to communicate what the data is saying.
A well-designed Power BI report should help users quickly identify important information instead of forcing them to interpret large tables of numbers.
Features such as bookmarks, tooltips, interactive filters, drill-through options, and report navigation can improve the user experience and make reports more useful.
Discovering Trends and Patterns with Power BI
One of the key responsibilities of a data analyst is identifying patterns that may not be immediately visible in raw data.
Power BI provides analytical capabilities that can help users explore trends, compare periods, identify unusual values, and examine different segments of a dataset.
The current PL-300 exam scope includes analytical features such as grouping, clustering, forecasting, anomaly detection, and certain AI capabilities available within Power BI.
These capabilities make Power BI more than a reporting tool. They allow analysts to explore data and uncover insights that can support business decisions.
Managing and Securing Power BI
Creating a report is only one part of the data analytics process. In professional environments, organizations also need to control how reports and datasets are shared.
Power BI provides workspaces and security features that help organizations manage content and control user access.
The current PL-300 exam includes skills related to managing workspaces, publishing and distributing content, creating dashboards, configuring refresh schedules, and securing Power BI content.
It also includes Row-Level Security, which can help organizations control the data different users are allowed to view.
For example, a regional manager might be allowed to view information related only to their region, while senior management may have access to the organization's complete dataset.
What Skills Does the PL-300 Exam Cover?
Microsoft currently divides the PL-300 exam into four main skill areas:
-
Prepare the data: 25–30%.
-
Model the data: 25–30%.
-
Visualize and analyze the data: 25–30%.
-
Manage and secure Power BI: 15–20%.
This distribution demonstrates that the certification covers the complete Power BI workflow rather than focusing exclusively on dashboard creation.
A strong preparation strategy should therefore address all four areas instead of concentrating only on visualization.
Power BI Data Analyst Certification Exam
The PL-300 exam is the examination associated with the Microsoft Power BI Data Analyst certification.
According to Microsoft, the current exam duration is 100 minutes, and the passing score is 700 or higher.
Microsoft regularly updates certification exams to reflect changes in technology and job responsibilities. The PL-300 skills measured were updated on April 20, 2026, making it important for candidates to review the latest official exam guide before preparing.
Using the latest study guide is particularly important because Power BI continues to evolve, including new analytical and AI-powered capabilities.
Is the Power BI Certification Suitable for a Data Analyst Career?
The Power BI Data Analyst certification can be a valuable addition to a career path in data analytics and business intelligence.
It provides a structured way to demonstrate knowledge of Power BI and the major tasks associated with the Data Analyst role.
However, becoming a strong data analyst requires more than earning a certification. Analytical thinking, problem-solving, business understanding, data interpretation, and communication are equally important.
It can also be useful to develop complementary skills such as Excel, SQL, statistics, database concepts, and data visualization principles.
Therefore, the Power BI certification should be viewed as part of a broader professional development journey rather than the final step in learning data analytics.
Career Opportunities Related to Power BI
Power BI skills can be relevant to several data-focused roles.
Potential job titles may include:
-
Data Analyst.
-
Business Analyst.
-
Business Intelligence Analyst.
-
Reporting Analyst.
-
Performance Analyst.
-
Business Intelligence Specialist.
-
Operations Analyst.
The responsibilities associated with these positions can vary significantly.
For example, one organization may need an analyst who focuses mainly on dashboards and reporting, while another may require advanced data modeling, performance analysis, and business intelligence capabilities.
For this reason, learners should review actual job descriptions and identify the skills most commonly requested in their target market.
The Importance of Power BI Certification on a Resume
Professional certifications can help candidates communicate their technical knowledge to employers.
The Microsoft Certified: Power BI Data Analyst Associate certification demonstrates knowledge across several areas of Power BI, including data preparation, modeling, visualization, analysis, and management.
However, certification alone is not enough to demonstrate practical expertise.
A stronger professional profile can be created by combining certification with real-world projects.
For example, a learner could build a sales dashboard, analyze customer behavior, create a financial performance report, or develop an interactive business performance dashboard.
These projects can provide evidence that the learner understands how to apply Power BI skills to real data problems.
How to Prepare for the Power BI Data Analyst Certification
A successful preparation strategy should combine theoretical learning with hands-on practice.
Start by learning the fundamentals of Power BI and understanding how to connect it to different data sources.
Next, practice using Power Query to clean and transform datasets.
After that, focus on data modeling and relationships between tables. Once the data model is understood, begin developing DAX measures and calculations.
The next step is to practice creating professional reports and dashboards. Experiment with different visualizations and learn how filters, slicers, interactions, and navigation features affect the user experience.
It is also useful to practice with different datasets rather than relying on a single example.
Microsoft provides official preparation resources for the PL-300 exam, including a study guide and other learning resources through Microsoft Learn.
Why Practical Projects Matter
Passing the certification exam can demonstrate knowledge, but practical projects help demonstrate the ability to apply that knowledge.
A useful Power BI project can begin with raw data and follow the complete analytics process.
For example, a learner could start with several years of sales records, clean the data using Power Query, build relationships between tables, create DAX measures, and then design an interactive dashboard.
The final step could be writing a short analysis explaining the most important findings from the data.
This type of project demonstrates more than technical knowledge. It shows the ability to move from raw data to meaningful business insights.
The Future of Data Analytics with Power BI
As organizations continue to rely on data-driven decision-making, professionals who can transform data into understandable insights are likely to remain valuable across many industries.
Power BI continues to evolve with new analytical, visualization, automation, and artificial intelligence capabilities. The current PL-300 exam scope itself includes certain AI and Copilot-related capabilities, reflecting the changing nature of the Power BI Data Analyst role.
However, technology alone does not create a successful data analyst.
The ability to understand a business problem, ask the right questions, select appropriate data, interpret results, and communicate findings remains essential.
This means that future data analysts will benefit from combining technical Power BI skills with analytical thinking and strong business understanding.
Start Your Data Analytics Journey with Be Pioneer
If you are interested in developing a career in data analytics, learning Power BI can be an important step toward understanding how organizations transform data into useful information.
A successful learning journey combines technical skills, practical projects, analytical thinking, and professional certification.
Through Be Pioneer, learners can explore professional development opportunities that support continuous learning and help them develop skills aligned with the changing demands of the modern job market.
Whether you are beginning your journey in data analytics or looking to strengthen your existing technical skills, Power BI can provide a practical foundation for working with business data, creating interactive reports, and communicating valuable insights.